2020 primary Elections Nevada results
With the highest proportion of Latino voters among the early voting states, Nevada is commonly seen as an early bellwether of how well candidates are performing with the group — a key Democratic constituency. Thirty-six pledged delegates are up for grabs.
Nevada Republicans canceled their caucus this year.
Presidential caucus results
Democrats / 36 Delegates
100% in
The following is a summary of Nevada's Democratic Caucus. Nevada has 36 delegates and 48 available delegates including supers.
- Democrat
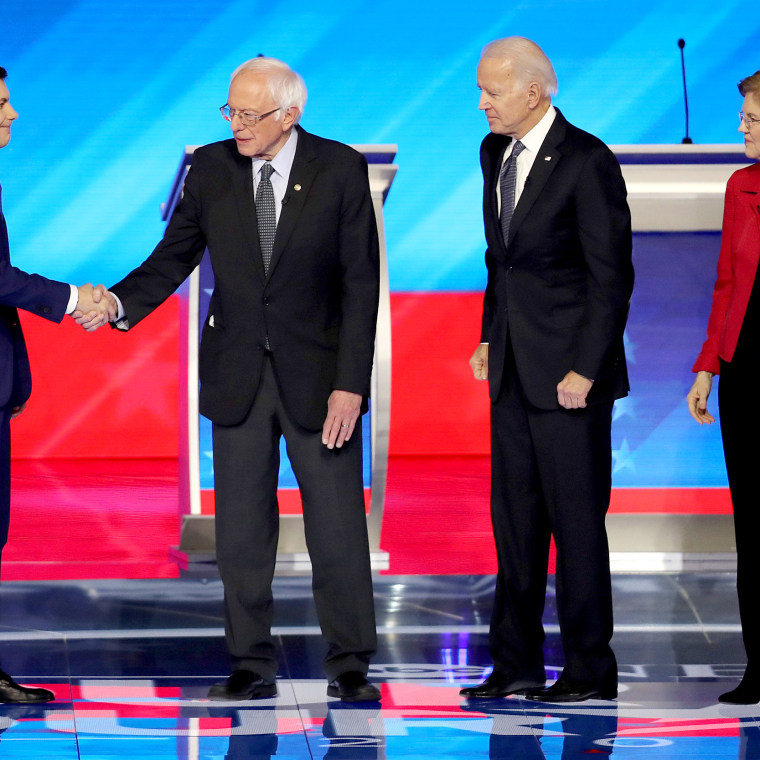
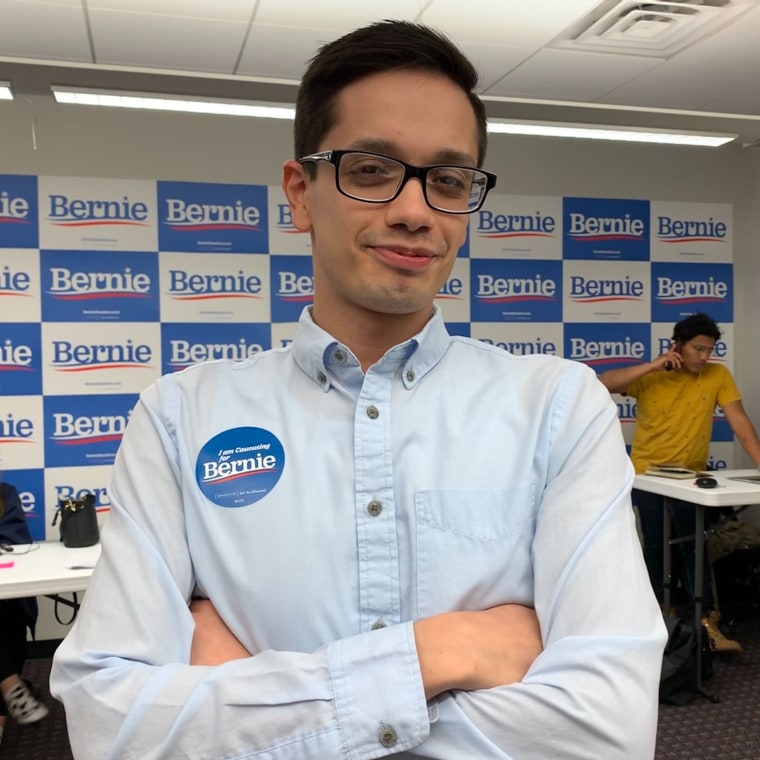
Bernie SandersWinner
46.8%
6,788
+ 24 Delegates
- Democrat
Joe BidenWinner
20.2%
2,927
+ 9 Delegates
- Democrat
Pete ButtigiegWinner
14.3%
2,073
+ 3 Delegates
- Democrat
Elizabeth WarrenWinner
9.7%
1,406
- Democrat
Tom SteyerWinner
4.7%
682
- Democrat
Amy KlobucharWinner
4.2%
603
- Democrat
UncommittedWinner
0%
7
- Democrat
Tulsi GabbardWinner
0%
4
- Democrat
Andrew YangWinner
0%
1
- Democrat
Michael BennetWinner
0%
0
- Democrat
John DelaneyWinner
0%
0
- Democrat
Deval PatrickWinner
0%
0
Carson City
100% in
Feb. 24 2020, 8:35PM ET
Candidate Percent Votes Sanders 44.4% 96
Buttigieg 18.1% 39
Klobuchar 15.3% 33
Steyer 8.8% 19
Warren 8.8% 19
Biden 4.6% 10
Gabbard 0% 0
Uncommitted 0% 0
Churchill
100% in
Feb. 24 2020, 8:36PM ET
Candidate Percent Votes Sanders 34.1% 31
Buttigieg 19.8% 18
Steyer 14.3% 13
Biden 13.2% 12
Klobuchar 9.9% 9
Warren 8.8% 8
Gabbard 0% 0
Uncommitted 0% 0
Clark
100% in
Feb. 24 2020, 8:37PM ET
Candidate Percent Votes Sanders 49% 5,293
Biden 24.3% 2,623
Buttigieg 12% 1,297
Warren 8.5% 917
Steyer 4.1% 442
Klobuchar 2.1% 230
Gabbard 0% 3
Uncommitted 0% 2
Douglas
100% in
Feb. 24 2020, 8:40PM ET
Candidate Percent Votes Buttigieg 32% 79
Sanders 30.8% 76
Klobuchar 15.4% 38
Warren 10.5% 26
Steyer 6.1% 15
Biden 5.3% 13
Gabbard 0% 0
Uncommitted 0% 0
Elko
100% in
Feb. 24 2020, 8:40PM ET
Candidate Percent Votes Sanders 39.3% 42
Buttigieg 21.5% 23
Klobuchar 15.9% 17
Warren 14% 15
Biden 8.4% 9
Uncommitted 0.9% 1
Gabbard 0% 0
Steyer 0% 0
Esmeralda
100% in
Feb. 23 2020, 4:09AM ET
Candidate Percent Votes Sanders 57.9% 11
Buttigieg 21.1% 4
Biden 10.5% 2
Warren 10.5% 2
Gabbard 0% 0
Klobuchar 0% 0
Steyer 0% 0
Uncommitted 0% 0
Eureka
100% in
Feb. 24 2020, 12:33AM ET
Candidate Percent Votes Sanders 77.8% 14
Buttigieg 22.2% 4
Biden 0% 0
Gabbard 0% 0
Klobuchar 0% 0
Steyer 0% 0
Uncommitted 0% 0
Warren 0% 0
Humboldt
100% in
Feb. 24 2020, 8:41PM ET
Candidate Percent Votes Sanders 46% 40
Buttigieg 20.7% 18
Biden 10.3% 9
Klobuchar 9.2% 8
Steyer 5.7% 5
Warren 5.7% 5
Gabbard 1.1% 1
Uncommitted 0% 0
Lander
100% in
Feb. 24 2020, 11:02AM ET
Candidate Percent Votes Sanders 41.9% 26
Warren 24.2% 15
Biden 11.3% 7
Buttigieg 9.7% 6
Klobuchar 8.1% 5
Steyer 4.8% 3
Gabbard 0% 0
Uncommitted 0% 0
Lincoln
100% in
Feb. 24 2020, 8:47PM ET
Candidate Percent Votes Buttigieg 43.9% 25
Sanders 42.1% 24
Steyer 10.5% 6
Biden 3.5% 2
Gabbard 0% 0
Klobuchar 0% 0
Uncommitted 0% 0
Warren 0% 0
Lyon
100% in
Feb. 24 2020, 8:46PM ET
Candidate Percent Votes Sanders 33.9% 58
Buttigieg 25.1% 43
Biden 11.7% 20
Steyer 11.1% 19
Warren 9.9% 17
Klobuchar 6.4% 11
Uncommitted 1.8% 3
Gabbard 0% 0
Mineral
100% in
Feb. 24 2020, 11:04AM ET
Candidate Percent Votes Steyer 28.6% 16
Buttigieg 26.8% 15
Sanders 23.2% 13
Warren 8.9% 5
Biden 7.1% 4
Klobuchar 5.4% 3
Gabbard 0% 0
Uncommitted 0% 0
Nye
100% in
Feb. 24 2020, 8:42PM ET
Candidate Percent Votes Buttigieg 28.7% 47
Sanders 25% 41
Steyer 23.2% 38
Biden 15.9% 26
Warren 4.3% 7
Klobuchar 3% 5
Gabbard 0% 0
Uncommitted 0% 0
Pershing
100% in
Feb. 24 2020, 8:46PM ET
Candidate Percent Votes Buttigieg 30.4% 21
Steyer 18.8% 13
Klobuchar 17.4% 12
Biden 13% 9
Sanders 13% 9
Warren 7.2% 5
Gabbard 0% 0
Uncommitted 0% 0
Storey
100% in
Feb. 24 2020, 8:43PM ET
Candidate Percent Votes Sanders 33.8% 25
Buttigieg 20.3% 15
Biden 14.9% 11
Steyer 12.2% 9
Klobuchar 9.5% 7
Warren 9.5% 7
Gabbard 0% 0
Uncommitted 0% 0
Washoe
100% in
Feb. 24 2020, 8:39PM ET
Candidate Percent Votes Sanders 44.2% 959
Buttigieg 18% 390
Warren 16.3% 354
Klobuchar 10.1% 220
Biden 7.6% 165
Steyer 3.7% 81
Uncommitted 0% 1
Gabbard 0% 0
White Pine
100% in
Feb. 24 2020, 8:43PM ET
Candidate Percent Votes Sanders 39.5% 30
Buttigieg 38.2% 29
Biden 6.6% 5
Klobuchar 6.6% 5
Warren 5.3% 4
Steyer 3.9% 3
Gabbard 0% 0
Uncommitted 0% 0
County breakdown
Democrats' initial preferences
Initial preference results are the raw vote totals from the first stage of the caucus in which voters express support for their first choice candidate.
Democrat | Democrat | Democrat | Democrat | Democrat | Democrat | Democrat | Democrat | Democrat | Democrat | Democrat | Democrat | |
|---|---|---|---|---|---|---|---|---|---|---|---|---|
| Initial Preference | 35,652 | 18,424 | 16,102 | 13,438 | 10,100 | 9,503 | 612 | 472 | 353 | 140 | 86 | 1 |
| Carson City | 823 | 324 | 421 | 330 | 443 | 337 | 0 | 3 | 15 | 0 | 0 | 0 |
| Churchill | 172 | 94 | 119 | 72 | 76 | 96 | 0 | 3 | 3 | 0 | 0 | 0 |
| Clark | 24,944 | 14,125 | 10,115 | 8,434 | 5,371 | 6,202 | 0 | 313 | 234 | 0 | 0 | 0 |
| Douglas | 632 | 403 | 608 | 292 | 517 | 373 | 0 | 8 | 7 | 0 | 0 | 0 |
| Elko | 267 | 93 | 169 | 86 | 100 | 19 | 0 | 9 | 5 | 0 | 0 | 0 |
| Esmeralda | 10 | 2 | 2 | 2 | 0 | 0 | 0 | 0 | 0 | 0 | 0 | 0 |
| Eureka | 9 | 1 | 3 | 1 | 0 | 0 | 0 | 0 | 0 | 0 | 0 | 0 |
| Humboldt | 87 | 29 | 47 | 14 | 30 | 14 | 0 | 2 | 5 | 0 | 0 | 0 |
| Lander | 28 | 9 | 5 | 19 | 9 | 10 | 0 | 0 | 0 | 0 | 0 | 0 |
| Lincoln | 15 | 6 | 15 | 2 | 3 | 5 | 0 | 2 | 0 | 0 | 0 | 0 |
| Lyon | 450 | 195 | 260 | 189 | 161 | 215 | 0 | 18 | 6 | 0 | 0 | 0 |
| Mineral | 26 | 13 | 30 | 12 | 11 | 24 | 0 | 1 | 0 | 0 | 0 | 0 |
| Nye | 298 | 245 | 288 | 125 | 138 | 268 | 0 | 5 | 1 | 0 | 0 | 0 |
| Pershing | 17 | 17 | 29 | 12 | 18 | 21 | 0 | 0 | 1 | 0 | 0 | 0 |
| Storey | 67 | 32 | 43 | 28 | 25 | 31 | 0 | 0 | 6 | 0 | 0 | 0 |
| Washoe | 7,760 | 2,821 | 3,912 | 3,809 | 3,183 | 1,880 | 0 | 100 | 70 | 0 | 0 | 0 |
| White Pine | 47 | 15 | 36 | 11 | 15 | 8 | 0 | 8 | 0 | 0 | 0 | 0 |
Democrats' reallocated preferences
Reallocated preference results are the raw vote totals from the second stage of the caucus after voters are able to shift their support to another candidate if their first-choice candidate does not receive enough support during the first, or initial preference, stage of the caucus. Only candidates who have met the viability threshold (15 percent in most caucus locations) receive votes in this stage.
Caucusgoers whose first-choice candidate do not meet the threshold have several options: They can move to a viable candidate; try to recruit supporters of other nonviable candidates to join their group in order to meet the threshold; move to another nonviable candidate and try to meet the threshold; or leave the caucus without indicating a second choice. Supporters of candidates who initially meet the threshold are not allowed to change their preference.
Democrat | Democrat | Democrat | Democrat | Democrat | Democrat | Democrat | Democrat | Democrat | Democrat | Democrat | Democrat | |
|---|---|---|---|---|---|---|---|---|---|---|---|---|
| Reallocated Preference | 41,075 | 19,179 | 17,598 | 11,703 | 7,376 | 4,120 | 367 | 49 | 36 | 32 | 8 | 0 |
| Carson City | 1,060 | 145 | 520 | 245 | 533 | 203 | 27 | 0 | 0 | 1 | 0 | 0 |
| Churchill | 199 | 85 | 139 | 48 | 63 | 91 | 0 | 0 | 0 | 0 | 0 | 0 |
| Clark | 29,162 | 16,279 | 10,468 | 6,833 | 2,692 | 2,398 | 228 | 0 | 0 | 21 | 0 | 0 |
| Douglas | 707 | 211 | 815 | 181 | 562 | 235 | 6 | 0 | 0 | 0 | 0 | 0 |
| Elko | 297 | 59 | 181 | 60 | 93 | 4 | 6 | 0 | 0 | 1 | 0 | 0 |
| Esmeralda | 10 | 2 | 3 | 1 | 0 | 0 | 0 | 0 | 0 | 0 | 0 | 0 |
| Eureka | 10 | 0 | 4 | 0 | 0 | 0 | 0 | 0 | 0 | 0 | 0 | 0 |
| Humboldt | 98 | 26 | 60 | 10 | 23 | 8 | 0 | 0 | 0 | 1 | 0 | 0 |
| Lander | 28 | 8 | 5 | 21 | 7 | 6 | 0 | 0 | 0 | 0 | 0 | 0 |
| Lincoln | 18 | 1 | 19 | 0 | 0 | 7 | 1 | 0 | 0 | 0 | 0 | 0 |
| Lyon | 528 | 157 | 340 | 138 | 110 | 171 | 16 | 0 | 0 | 1 | 0 | 0 |
| Mineral | 21 | 11 | 42 | 15 | 5 | 25 | 0 | 0 | 0 | 0 | 0 | 0 |
| Nye | 308 | 255 | 353 | 57 | 95 | 310 | 1 | 0 | 0 | 0 | 0 | 0 |
| Pershing | 12 | 13 | 35 | 9 | 15 | 24 | 1 | 0 | 0 | 0 | 0 | 0 |
| Storey | 81 | 40 | 41 | 26 | 20 | 23 | 4 | 0 | 0 | 0 | 0 | 0 |
| Washoe | 8,486 | 1,876 | 4,536 | 4,056 | 3,137 | 609 | 76 | 0 | 0 | 7 | 0 | 0 |
| White Pine | 50 | 11 | 37 | 3 | 21 | 6 | 1 | 0 | 0 | 0 | 0 | 0 |
Presidential entrance polls
Entrance polls are surveys of voters as they enter their caucus locations. The survey asks who caucus participants plan to support and includes questions to help explain voter attitudes and demographics.
Polls close at 8:00 P.M. ET, Feb. 22. Come back for results.
Democrats
Updated on Feb. 24 2020, 5:08PM ET
- Biden
- Buttigieg
- Gabbard
- Klobuchar
- Sanders
- Steyer
- Warren
- Uncommitted
Gender
Race
Race
Age
Age
Which best describes your education? You have:
What was the last grade of school you completed?
Education by race
Education by white by sex
No matter how you voted today, do you usually think of yourself as a:
On most political matters, do you consider yourself:
On most political matters, do you consider yourself:
On most political matters, do you consider yourself:
Does anyone in your household belong to a labor union?
Before today, had you ever attended a Nevada Democratic presidential caucus?
Which ONE of these four issues mattered most in deciding whom to support today?
How do you feel about replacing all private health insurance with a single government plan for everyone?
If you had to choose, would you rather see the Democratic Party nominate a candidate who:
Do you regularly use Twitter for political news?
Are you confident that the votes cast in the Nevada caucuses will be counted correctly?
When did you finally decide whom to support in today's caucus?
Time of decision
Time of decision
Region
Region
More 2020 coverage